Hey SBOM community,
Love to see you back here learning something new. If you’re working with SBOMs, you probably know that generating SBOM is just a first step. What you get after generating SBOM is just a raw SBOM ? And the raw SBOM is incomplete, inaccurate sometime and most importantly not even comply with NTIA minimum element according to this research whitepaper.
And that’s exactly where your involvement comes to enrich the SBOM, augument the SBOM, etc to make a better quality SBOM with completeness, accuracy and enriched data. At the end the real power of SBOM lies within itself i.e data. Because at the end these SBOM will be feeded to SBOM platform which perform complete analysis of the SBOM. The more complete and correct the data is, the more it helps you understand and reduce risk in your software supply chain.
To unleash the power of SBOMs, it needs to go through process like augmentation, enrichment, etc — adding missing fields, improving accuracy, aligning with compliance frameworks. And to check if your SBOM has made some improvements towards better quality, you want to check its quality, and for that there’s a tool: sbomqs.
sbomqs is a lightweight open source CLI tool that helps you measure the quality and compliance of SBOMs. To know more about refer to the repo.
Until now, sbomqs offered detailed compliance checks for NTIA, FSCT, OCT, BSI, and others. Alongside that, the score command provided a summarized scorecard, giving you a quick look at your SBOM’s health across categories like:
- NTIA compliance
- Structural completeness
- Data quality
- Semantic clarity
- Sharing readiness
This made it easier to get a fast, visual understanding of where your SBOM stands without digging deep into every field.
Before we get into the new additions, let’s look at how a summarized score for NTIA looks like.
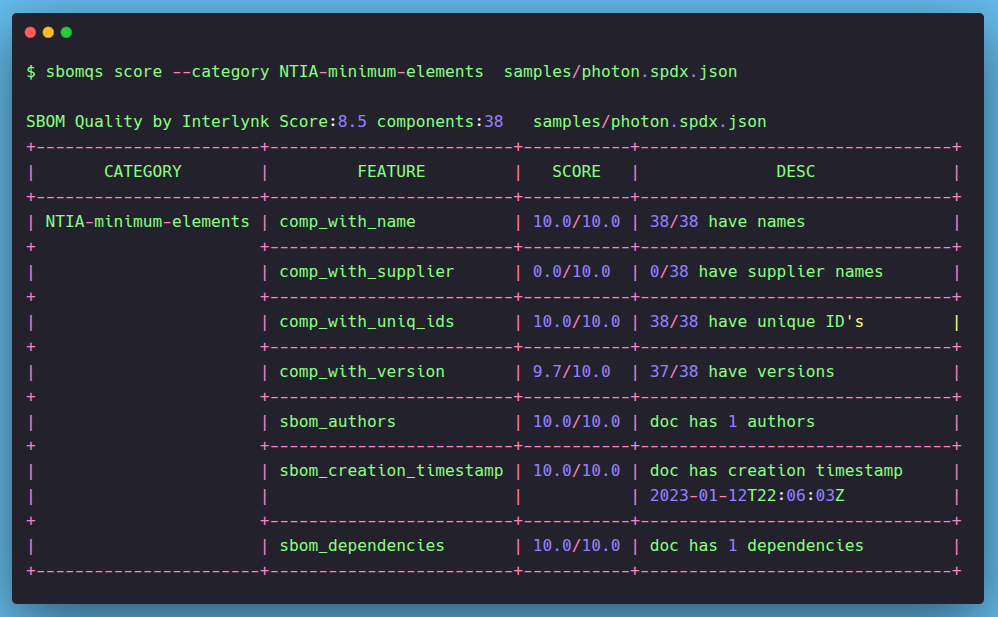
The score output gives you a clear table showing which key fields from the NTIA guidelines are present across your SBOM. For example, component_with_name checks whether each listed component includes a name. If all components are named, you’ll see a 100% score for that field. Other fields, like comp_with_version, comp_with_uniq_ids, and comp_with_supplier, follow the same idea—scanning for completeness based on NTIA expectations.
This format gives you quick visibility into which areas of your SBOM are solid, and where details might be missing.
To give you a better sense of how this looks, here’s what the table output means:
- The CATEGORY column tells you which standard the check belongs to (like NTIA or BSI).
- The FEATURE column lists the specific field or property being evaluated—for example, whether each component has a name, version, or checksum.
- The SCORE column shows how well your SBOM did for that field, with a perfect score being 10.0. Partial scores mean only some components passed that check.
- The DESC column provides context—like “37/38 have versions” or “0/38 have supplier names.” This helps pinpoint exactly where the SBOM is falling short.
This kind of breakdown makes it easy to interpret your SBOM’s quality at a glance.
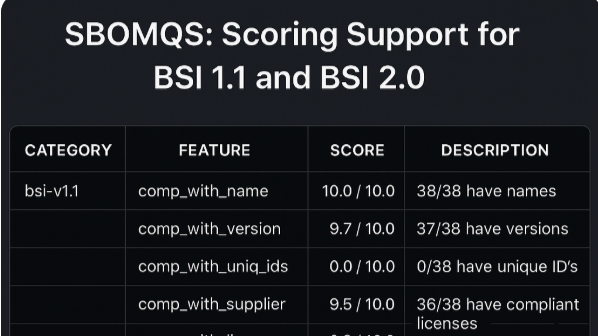
What’s New: Scoring Support for BSI 1.1 and BSI 2.0
We’ve now expanded the score command to include BSI-v1.1 and BSI-v2.0 compliance scoring. That means you can now you can get a score and summary of your SBOM against compliances like bsi-v1.1, bsi-v2.0, etc.
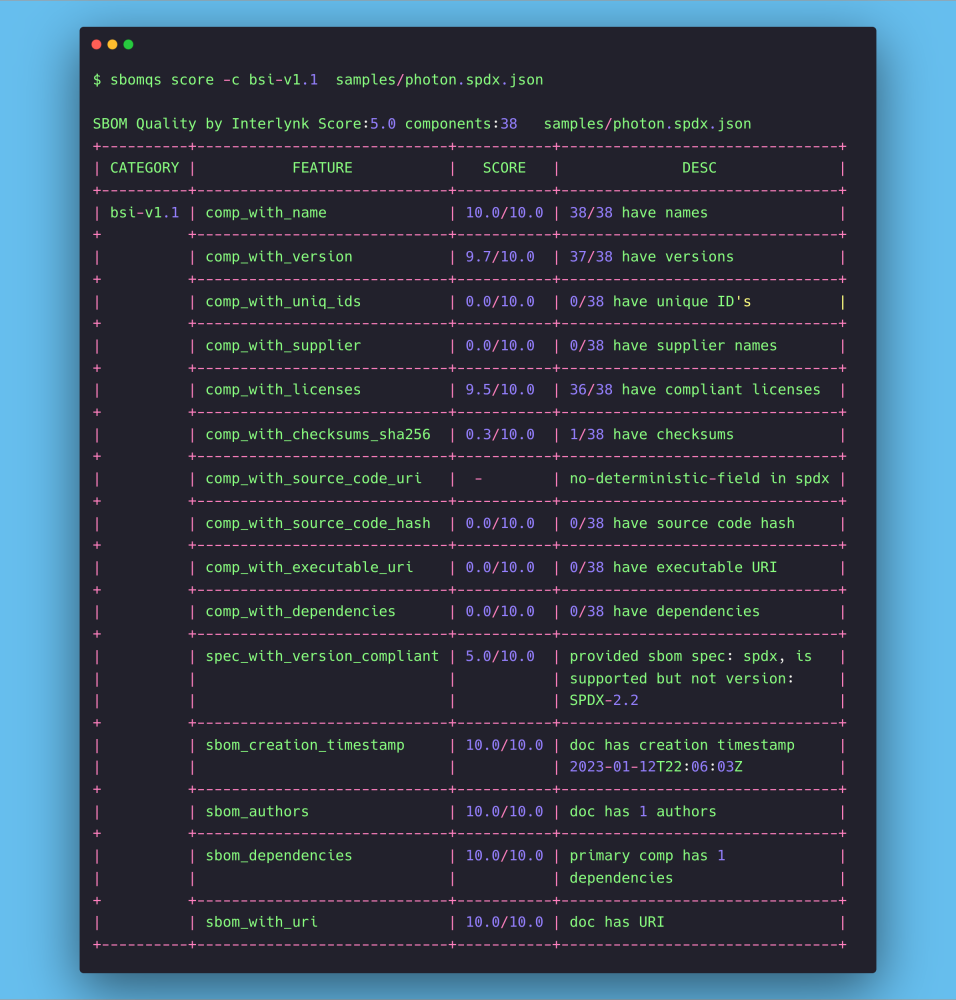
Let’s quickly see a summarized score against BSI-v1.1:
Similarly scoring for BSI-v2.0:
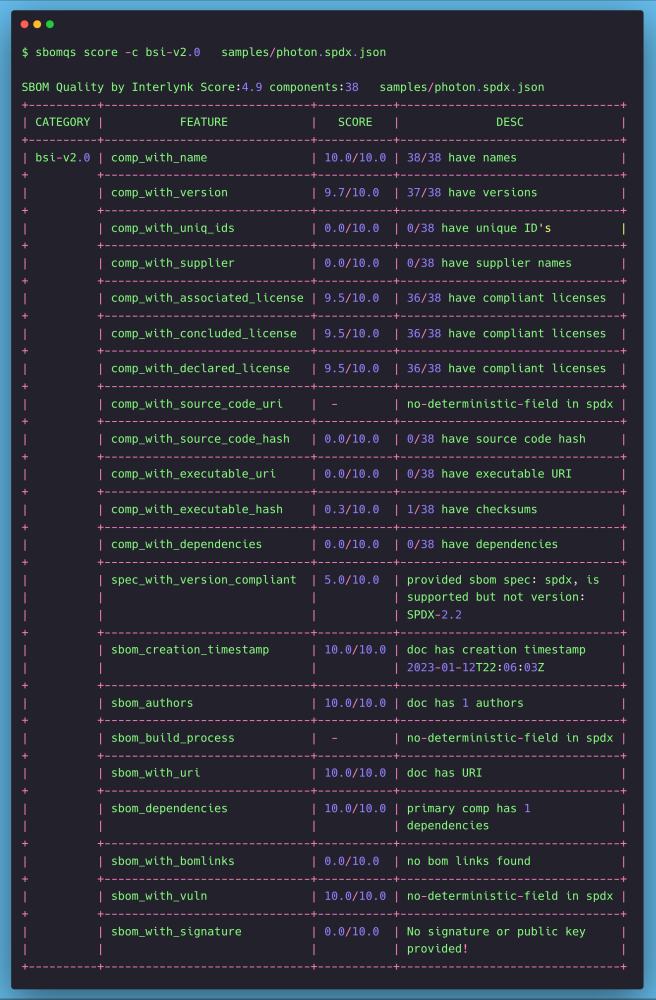
As compare to NTIA, bsi has more number of features to check. Now, once you get a summary of this score. Along with score you get to know how many number of components missing what features and how many have. This helps you better understanding of you SBOM overall. Now accordingly, you can update your SBOM with adding more values to it.
After identifying the overall gaps, you might want to dig deeper and see exactly which components are missing which fields. This helps you decide what needs to be added or enriched to improve the quality of your SBOM. To support this, sbomqs provides a list command that breaks it down component by component. For a full walkthrough, see our post on using sbomqs list to inspect what’s missing in your SBOM.
sbomqs list command
Let’s quickly look at the command and it’s o/p and see how many components have feature, comp_with_name.
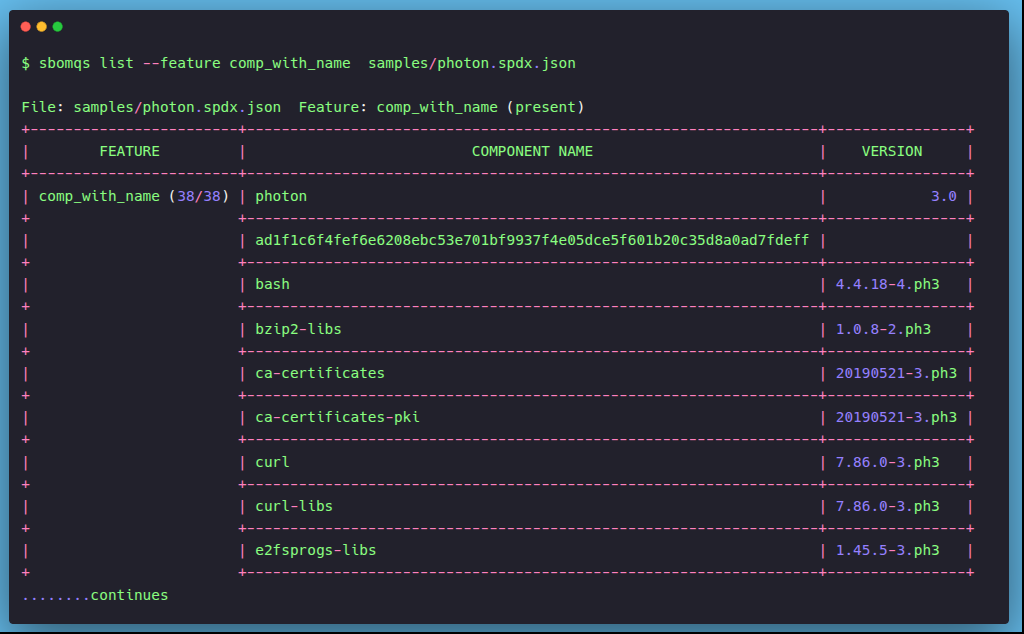
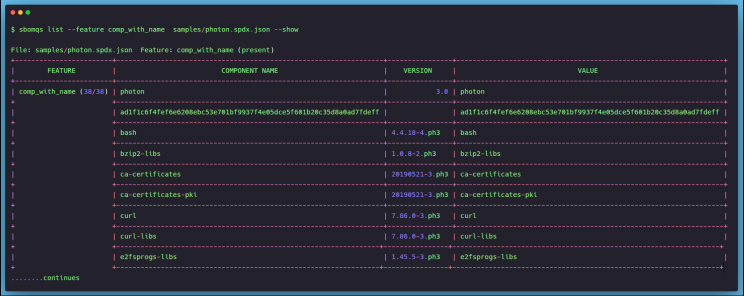
If you see the o/p, it shows that 38/38 components contains component name. Now let’s see the value of each feature that components have. To do so, add a –show flag in the list command:
By default, the list command shows which all components has a particular feature. To flip the view and see which components are missing it, just add the --missing flag.
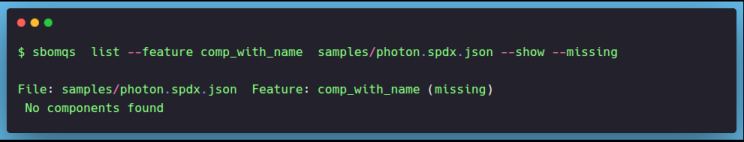
For example, if all components already have a name, the output will confirm that none are missing the comp_with_name field. Simple and direct.
Similarly, let see how many component is missing the feature comp_with_suppplier.
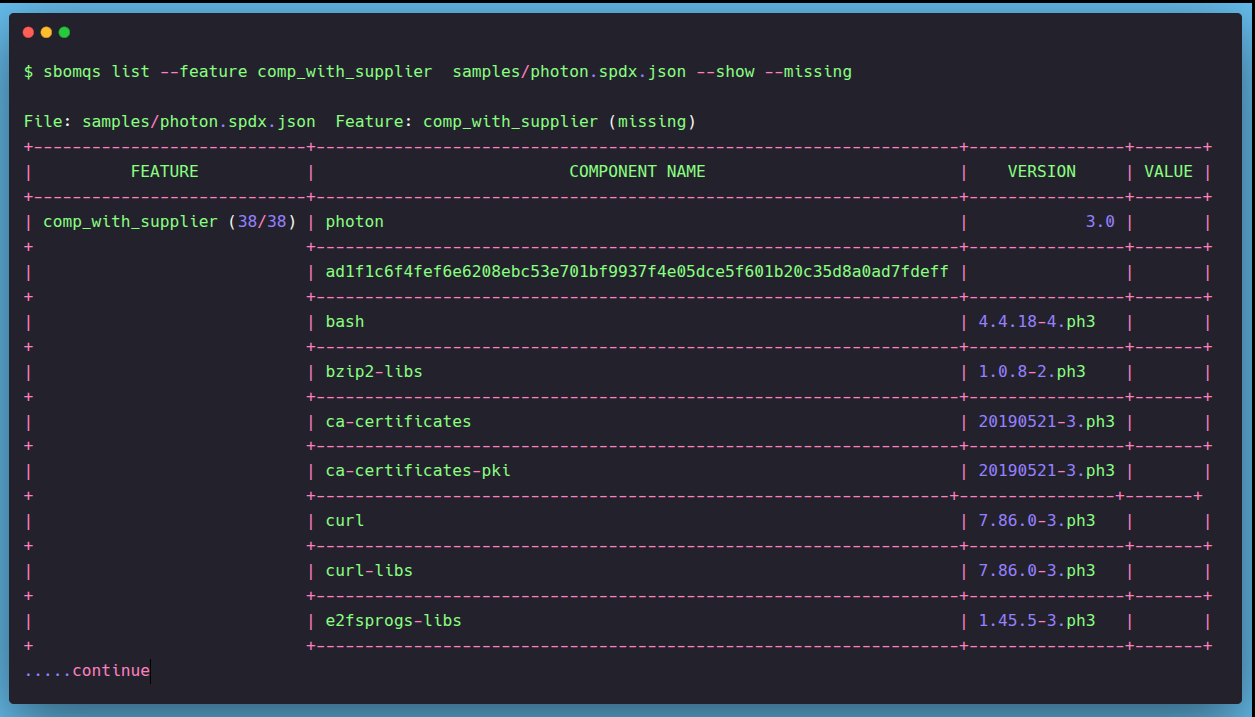
So, all components are missing this feature. Now, you can enrich the values accordingly. You can use tools like sbomasm and parlay tool for augmentation and enrichment respectively.
So, that’s how you can summarized SBOM scoring against BSI and NTIA and know exactly what your SBOM has. And to get the detailed analysis of each components against your compliances using sbomqs compliance command for the same. And then as per the gaps in your SBOMs, you can take further steps to enhance your SBOMs.
If you love the sbomqs tool, pour your love by ⭐ starring the repository.
That’s all for today. Keep learning and keep growing…
Before signing off, if you like to see the complete analysis of your SBOM, try our community version of Interlynk Platform. Visit official site interlynk.io and sign up.
External Resources
- sbomqs github repository
- sbomqs compliance readme
- NTIA Minimum elements compliance
- BSI-v1.1 compliance
- BSI-v2.0 compliance
- sbomasm and parlay github repo
- Interlynk community-tier